Operations dashboards
Leadership watches revenue, gross margin, inventory turns, and similar KPIs. Definitions are written down. You can drill to documents.
Custom software · Data
Lock definitions before you visualize. Operations dashboards, shop-floor screens, and alerts must drill to documents—not stop at a pretty picture.
01 / Method
Many companies do not lack charts. They lack one set of numbers. Finance, operations, and stores each run their own math. A handsome wall screen still cannot survive a weekly meeting. When DaXi builds a data project, we first write down three to five metrics that must be watched: who owns them, which table they come from, and whether they drill to documents.
Mid-size companies do not need a “big data platform” on day one. Get API contracts, master data, and permission audits right first. Add subject warehouses and real-time pipelines when you actually need them.
Does sales include returns? Is inventory by lot or live on-hand? Put it in a document before you draw, so the weekly meeting does not argue about the number.
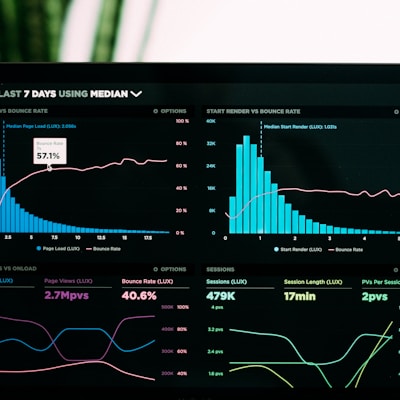
Open gross margin and you should see orders and stores—not a PNG-level wall screen.
When you still have few systems, standardize APIs and master data. Talk warehouse and scheduling once more systems connect.
02 / Deliverables
Each item maps to something people use and accept after launch—not empty charts for a demo.
Leadership watches revenue, gross margin, inventory turns, and similar KPIs. Definitions are written down. You can drill to documents.
Plants, warehouses, and stores see today's output, backlog, and exceptions. Refresh rate follows the floor.
Stock below safety, overdue orders, energy spikes—pushed to a person, not left on a chart.
Customer, material, and store codes are unified. Each KPI has one algorithm version.
Pull from business systems, finance, and devices. Failures retry. Row counts can be reconciled.
Who can see which layer of numbers. Sensitive KPIs open by role. Access is logged.
03 / Process
Each stage has a sign-off, so the project does not spin on color tweaks. View the full path
List the three to five metrics that must be watched, the owners, and where current definitions conflict.
Every chart maps to a table or API. If you cannot get the data, do not draw it yet.
Finance and operations agree in writing on the same number, then development starts.
Ship reports you can ask into first. Decorative wall screens come after.
Accept against real weekly-meeting questions. Turn off the parallel handmade Excel reports.
04 / Scenarios
Who looks, how often it refreshes, and whether it drills all change by scenario. Match the scenario before you debate a data platform.
Leadership / weekly meeting
Revenue, margin, collections, and inventory turns share one definition. The weekly meeting stops reconciling tables.
Which KPIs belong on the leadership dashboard firstPlant / warehouse
Today's output, backlog, and exception work orders on the wall. Supervisors do not walk back to the office to look them up.
What a plant and warehouse screen should showChain / roll-up
Each store's sales and stock roll up. A store sees its own numbers; HQ sees the outliers.
How chain roll-up avoids forked definitionsSystems / integration
Business, finance, and devices each produce a set of numbers. Standardize APIs and master data before you visualize.
What to standardize first when systems multiply05 / Guides
Why you need dashboards, what they deliver, common questions, and the difference with vs without data capability—each piece can be forwarded on its own, and they link to each other.
Before you start
Do not rush a wall screen before definitions agree. We write down where each number comes from and who owns it.
Inquiry
Start with the metrics you must watch and the numbers that currently disagree. That is faster than “we want a big data platform.”